Sessions Node
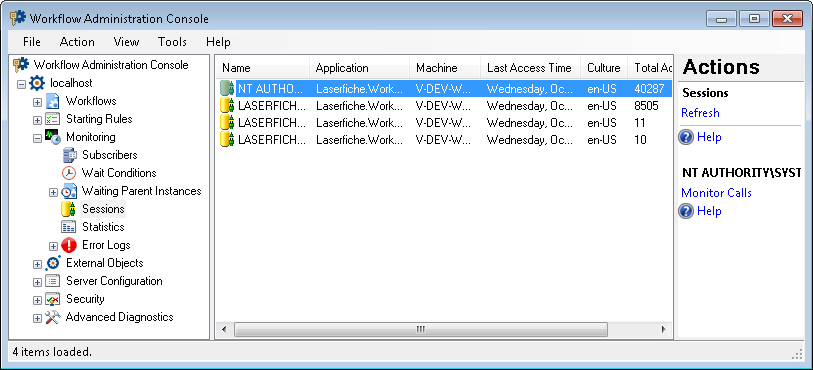
This node, under Monitoring in the Workflow Administration Console, displays columns that show
- The users, applications, and machines connected to the Workflow Server.
- The last time each connection accessed the server.
- The connection's language and regional settings (culture).
- The total number of calls each connection made to the server (total activity).
- Optionally, the connection's IP, login time, logout time, ID (UUID number), number of downloads, operations, CPU Time, SID, and application ID. More information.
You can also monitor the calls each connection makes to the server from this node.
To open this node
- In the Workflow Administration Console's Console Pane, expand the Monitoring node.
- Select Sessions.
Tip: You can refresh this list to reflect recent changes by clicking the Refresh link below Sessions in the Actions Pane. Alternatively, right-click the Sessions node and select Refresh.
To monitor calls a connection is making to the server
- In the center Details Pane, select the connection you want to monitor.
- Click Monitor Calls under the connection's name in the Actions Pane. Alternatively, right-click the connection and select Monitor Calls.
- The
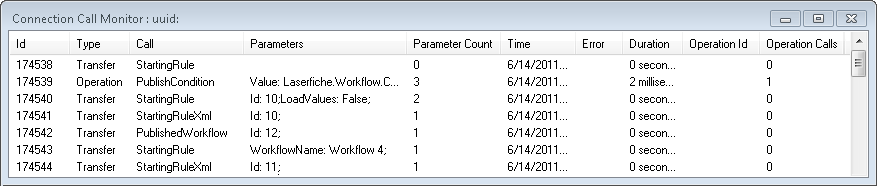
 Connection Call Monitor dialog box will open.
 - The Connection Call Monitor dialog box displays columns that show the call ID, connection type, call type, parameters, parameter count, time of connection, errors, duration of connection, operation ID, and operation calls.
- Optional: Right-click in the call monitor to pause updates, refresh the call monitor, or export the call log as a .csv file.
To export the contents of this node in a .csv, .xml, or .txt file
- Select the node in the Console Pane.
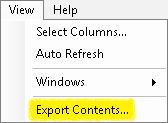
- Select View from the main menu.
- Click Export Contents.
- In the Export data dialog box, name the exported file.
- Select CSV File, XML File, or Tab Delimited Text File from the drop-down menu.
- Click Save.